Asset Intelligence
Know the real assets behind every capital decision
We value a network, cost its obligations, measure its health and forecast its demand, from public records and your data.
Example: a map of small areas switching from gas to heat pumps over time, unevenly across the network.
How Asset Intelligence works
- 01
What drives demand, area by area
Here, two models of heat pump adoption, for homes and for non-domestic buildings, run for every small UK area from 2022 to 2050 across many scenarios.
- 02
Demand changes unevenly
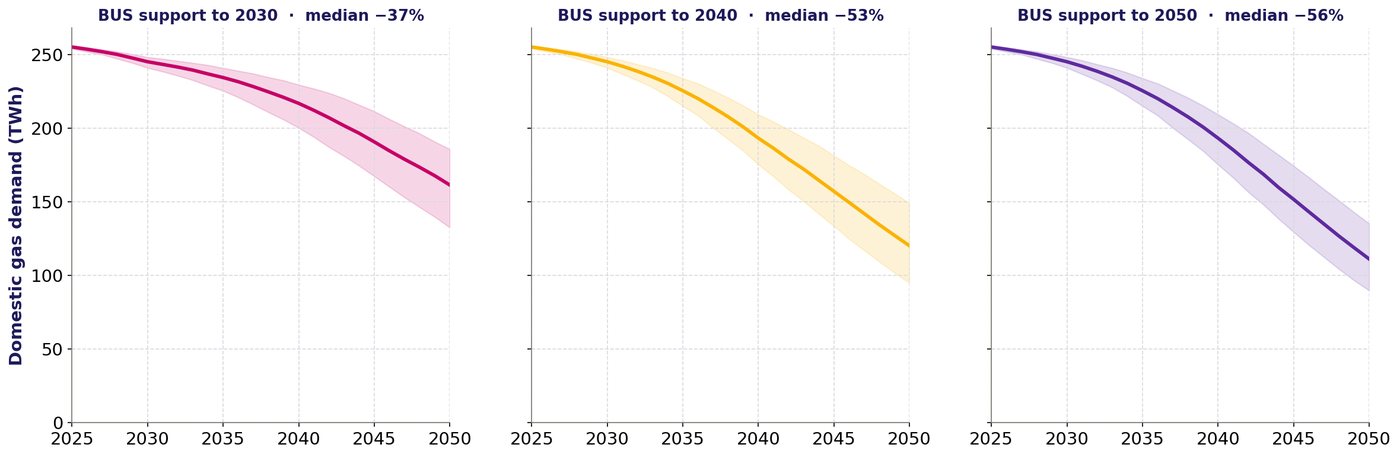
Each scenario gives a path for gas demand; together they show the likely change and its uncertainty.
UK gas demand could fall by 28% to 93% by 2050. Source: Vallorii analysis, reported in Utility Week, Jul 6, 2025.
- 03
Which assets are still needed, and when
A gas pipe can retire once the areas it serves no longer need it.
- 04
Where asset risk sits, in pounds
Each asset carries a value, a liability and a health score.
- 05
Where to invest first
We rank areas by stranding risk, and by where network dependency and deprivation are both high.
- Stranded pipe by year
- Emissions avoided
- Vulnerable areas
- Investment priorities
Three questions it answers
Network forecasting
For network strategy, planning and regulation teams
Which assets will we still need, and where will new load arrive?
Asset health and liabilities
For network asset, regulation and investment teams
Where does asset risk sit on the network, in pounds?
Value and obligations
For network owners, investors and lenders
What are the assets worth against their regulated value, and what do their obligations cost?
Real examples
Applied to real networks
Built from public data. Naming a company does not mean it gave us data.
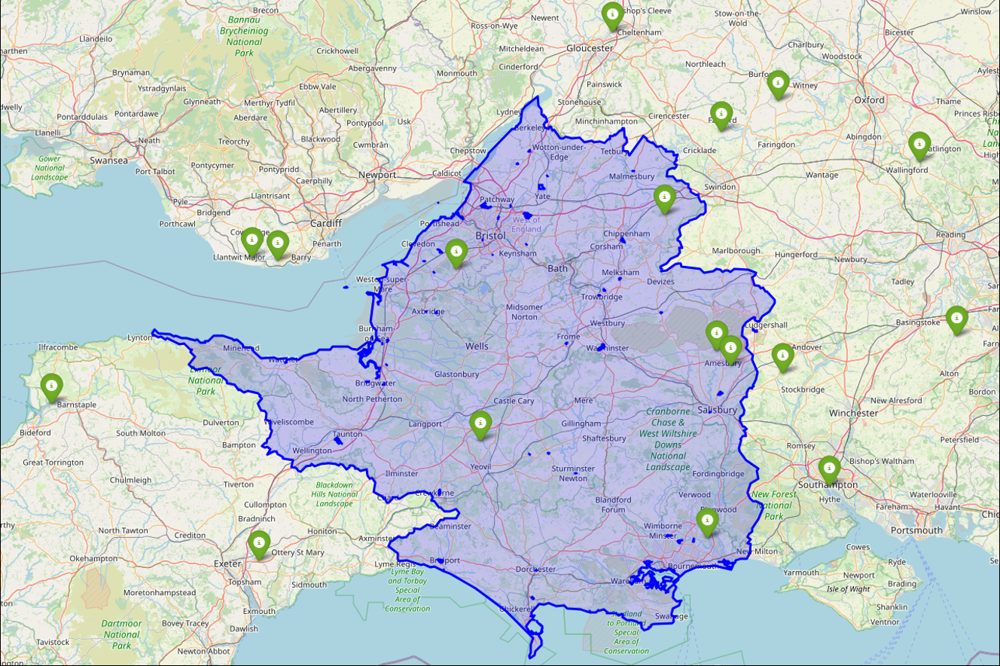
Local conditions · Wessex Water area
We map each asset with the weather, ground and people around it
We match weather stations to each census area in the Wessex Water area.
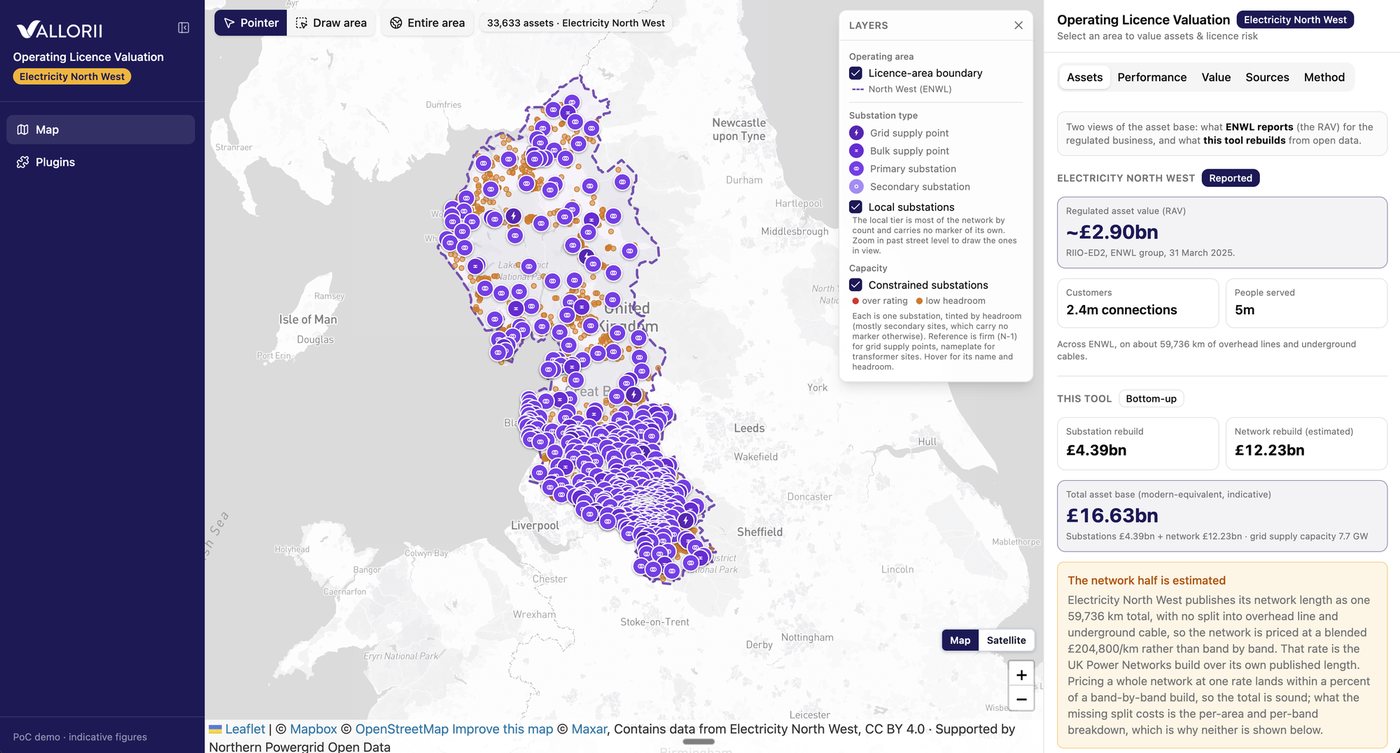
Replacement value · Electricity North West
About 5.7 times its regulated value to rebuild
Rebuilding it would cost about £16.63bn, against a regulated asset value of about £2.9bn (RIIO-ED2, 31 March 2025).
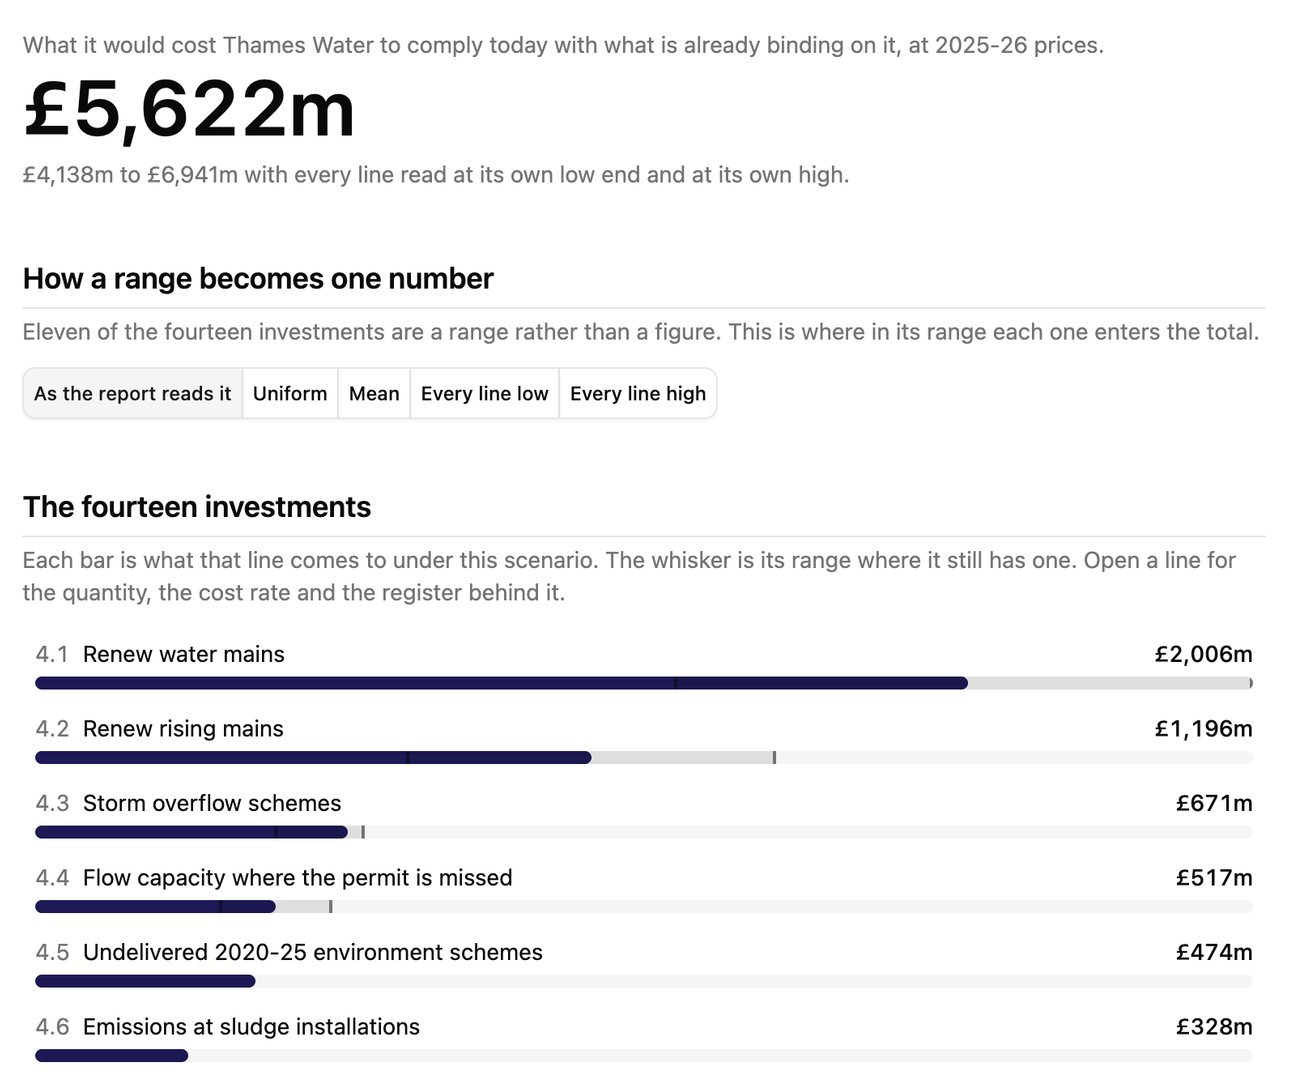
Cost of compliance · Thames Water
About £5,622m to meet its licence and commitments
We set each asset against its licence conditions and commitments, in 2025-26 prices.
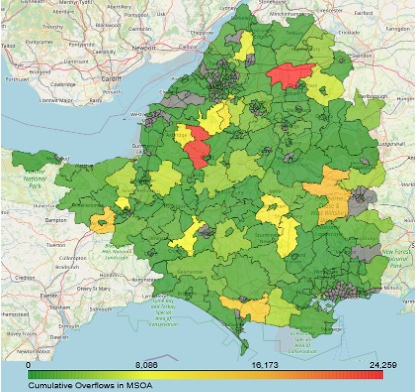
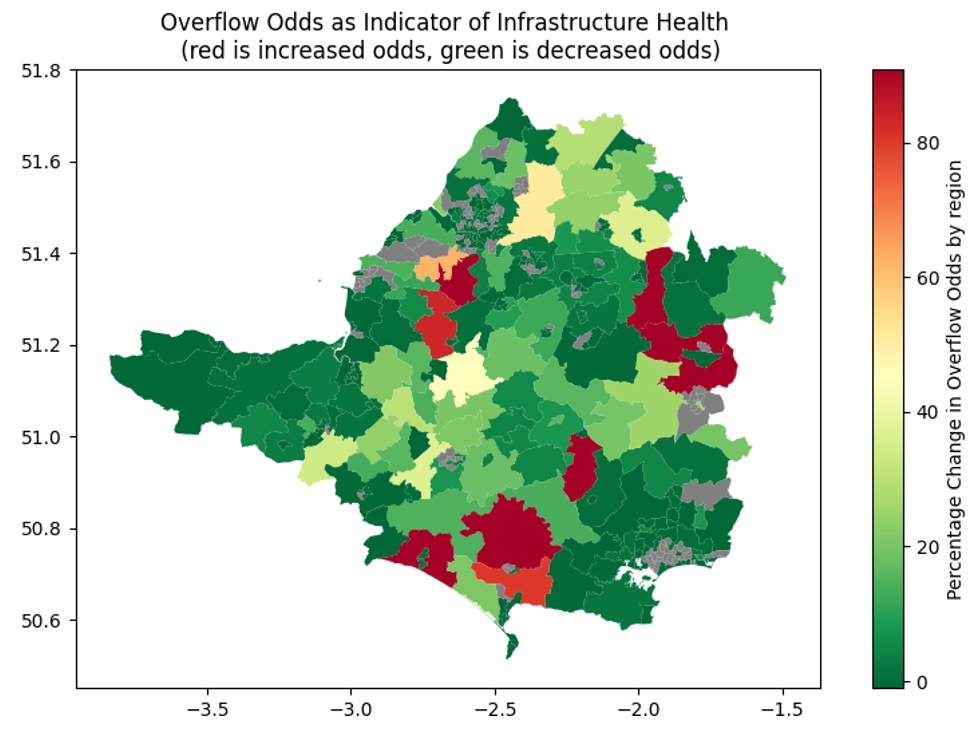
Asset health · Wessex Water
Take out weather and population, and different areas need attention
Left are 2023 overflows per area; right are the overflows that weather and population do not explain.
New load · England and Wales
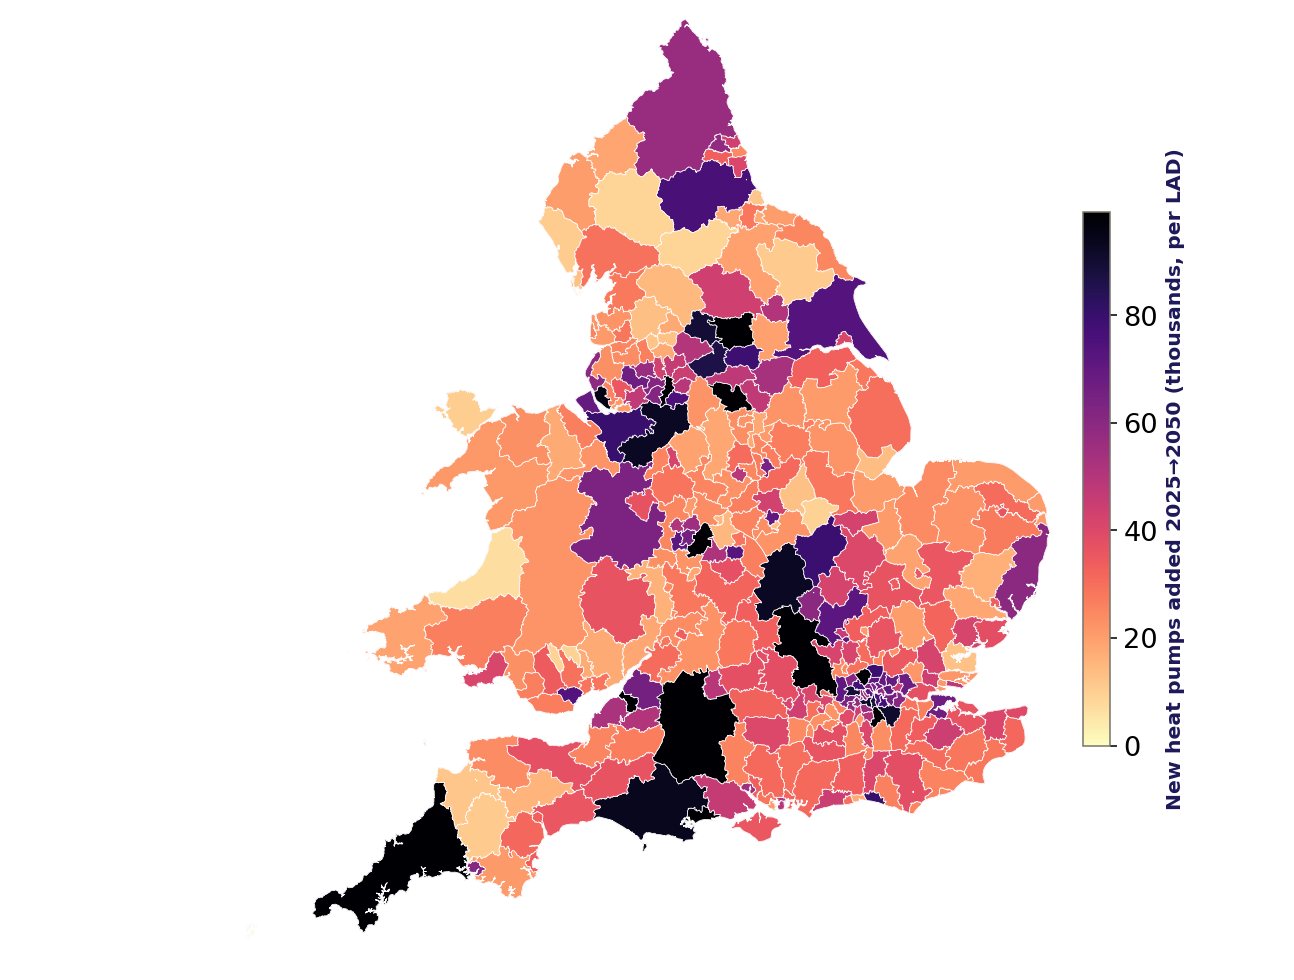
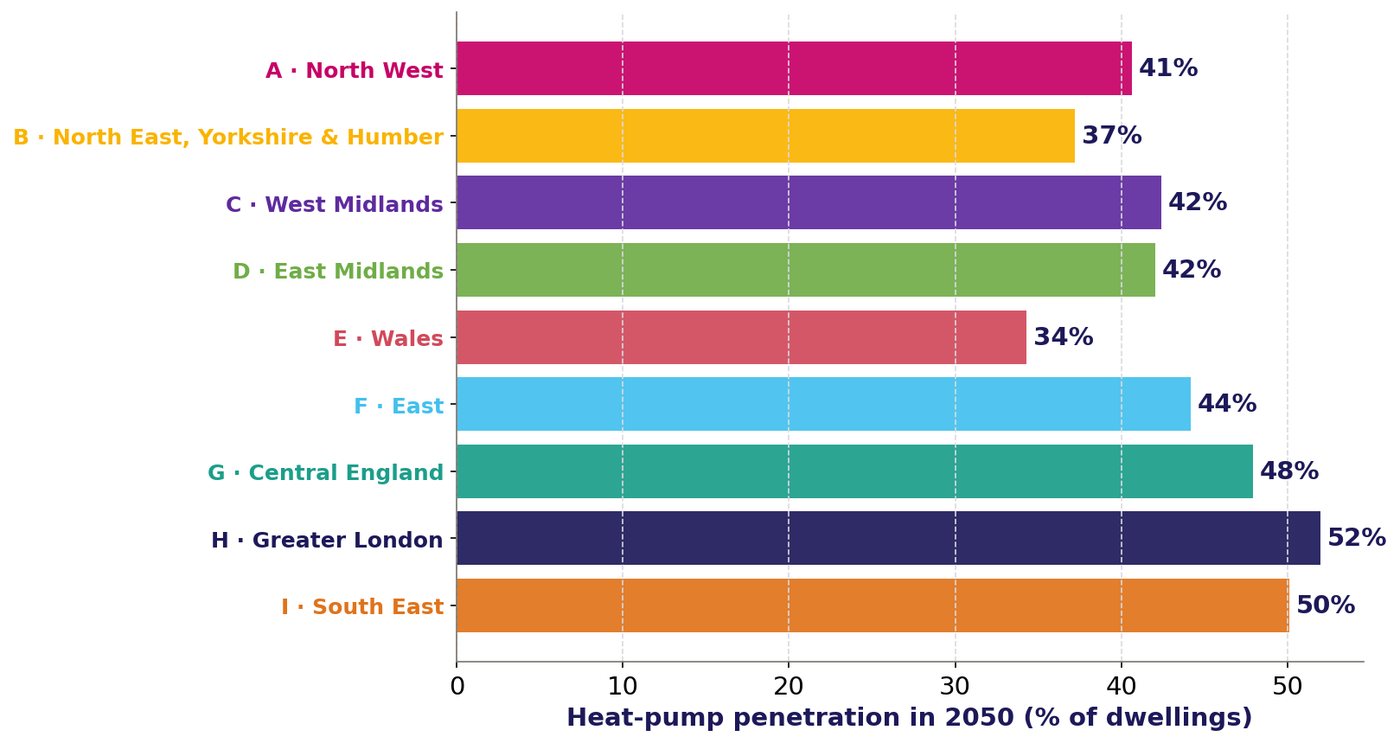
About 45% of homes on heat pumps by 2050, from 34% in Wales to 52% in Greater London
Electricity networks see where new heat pumps arrive, by local authority, from 2025 to 2050.
Demand to 2050 · England and Wales
Gas for home heating falls a median 56% by 2050 if heat pump grants last, and 37% if they end in 2030
Each grant end year runs 250 scenarios; the chart shows the median and the P10 to P90 range.